
InsightsX1 for
reporting & insights
Establish KPIs, measure ongoing performance, and drive targeted actions with centralized reporting & self-service BI


- Business reporting & data visualization
- Integrated business intelligence (BI) reporting
- Granular reporting capabilities
- Advanced data availability
- APIs for external data use
-
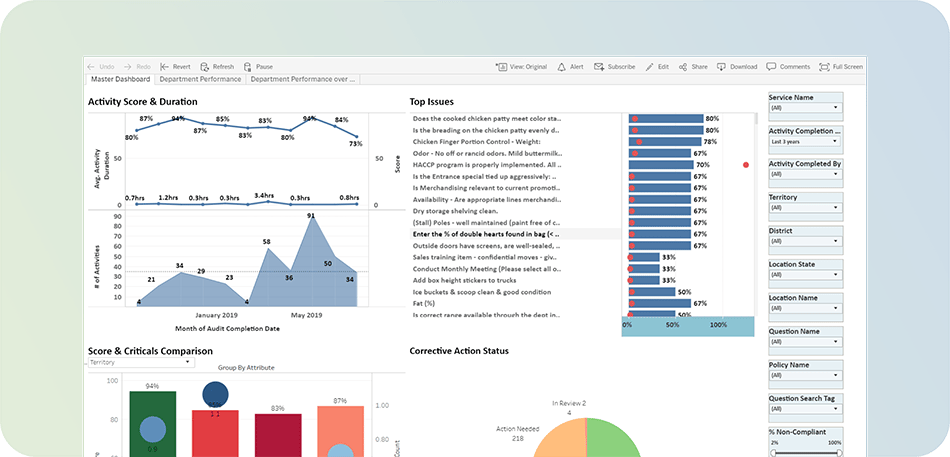
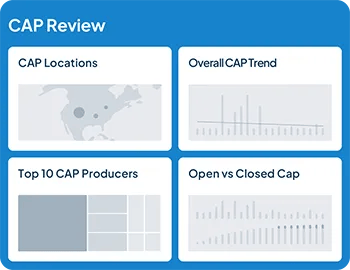
Business reporting & data visualization
CMX1 uses “smart data grids” to organize all records and information stored in the X1 platform. Users have complete control over the inclusion or exclusion of specific columns, their order, and sort logic—customizing views to what is most beneficial. Additionally, advanced filtering allows for on-the-fly report building while visualization options give users the ability to view data as a grid, chart, map, and more.

-
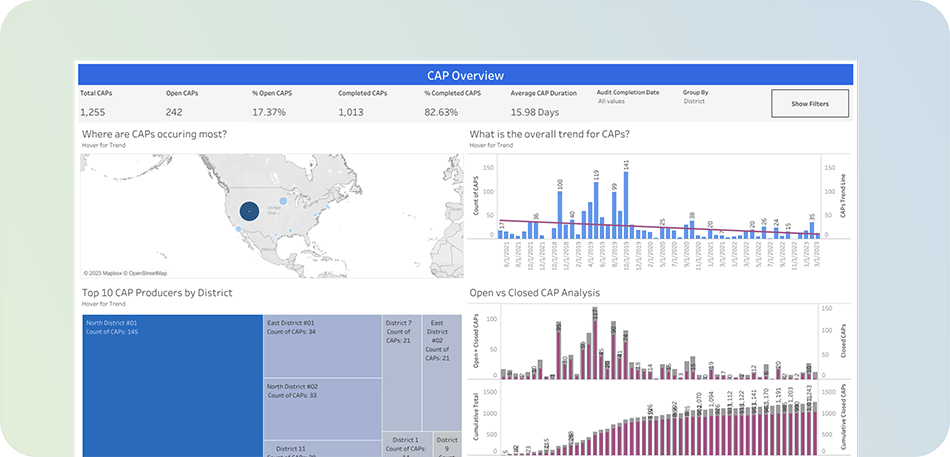
Integrated business intelligence (BI) reporting
Democratize data, empower users, and understand performance at every organizational level with real-time data integration through Tableau’s BI analytics & visualization platform. This widely favored and easy-to-use solution makes it easy for anyone in your organization to understand and leverage the data—from casual users needing to make high level, data-driven decisions to advanced data lovers wanting a more granular view through complex calculations and deeper slicing & dicing.
-
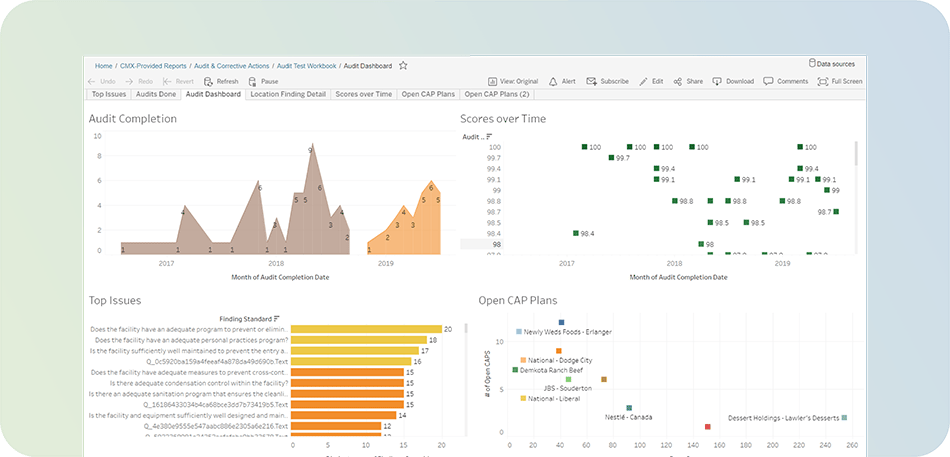
Granular reporting capabilities
The X1 platform’s master data management gives you unrivaled capabilities for generating custom reports to meet your complexity needs. Drive complex score calculations, including breakdowns by region, brand, location, department, reporting tags, and more. Generate multiple leave-behind PDF reports with distinct configurations to uniquely serve the stakeholders across your business.
-
Advanced data availability
Go beyond the custom leave-behind report and leverage our Tableau and Snowflake data integration to interrogate your data in limitless ways and generate the targeted insights you need. You can also embed these highly custom reports across the X1 platform with added filters and permissions to further empower your users.
-
APIs for external data use
If these listed features aren’t enough, your team always has the ability to export data from the X1 platform and make use of it externally. The data is yours to export from queues, run scheduled jobs, or access via APIs at any time.